Search and Find
Create Activity Pie Graph
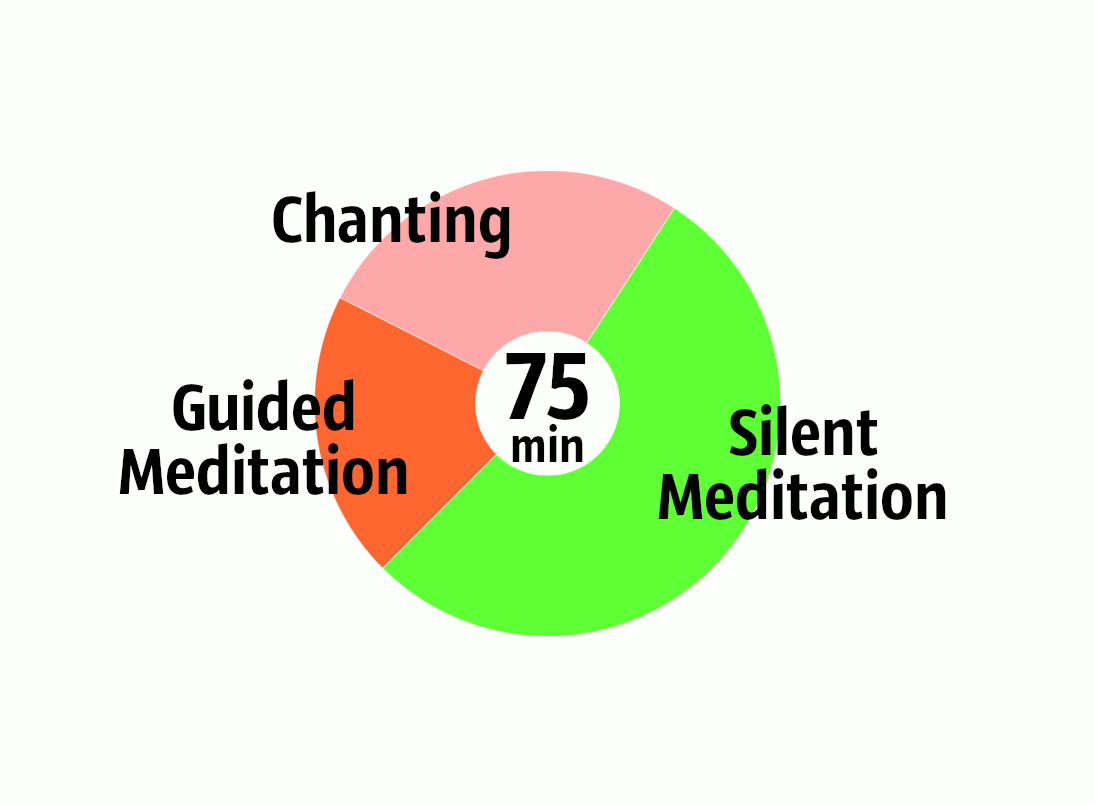
Help people understand your event by using a pie graph showing what happens at each event. For example:

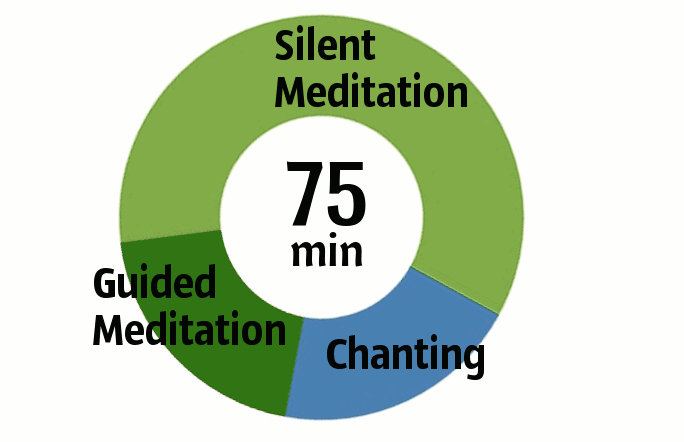
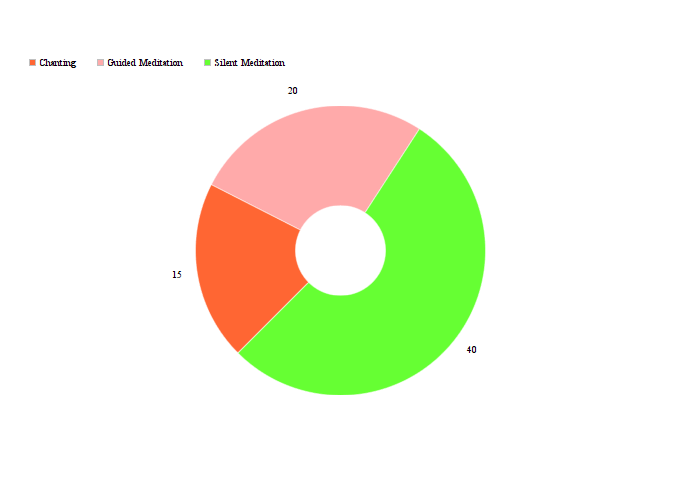
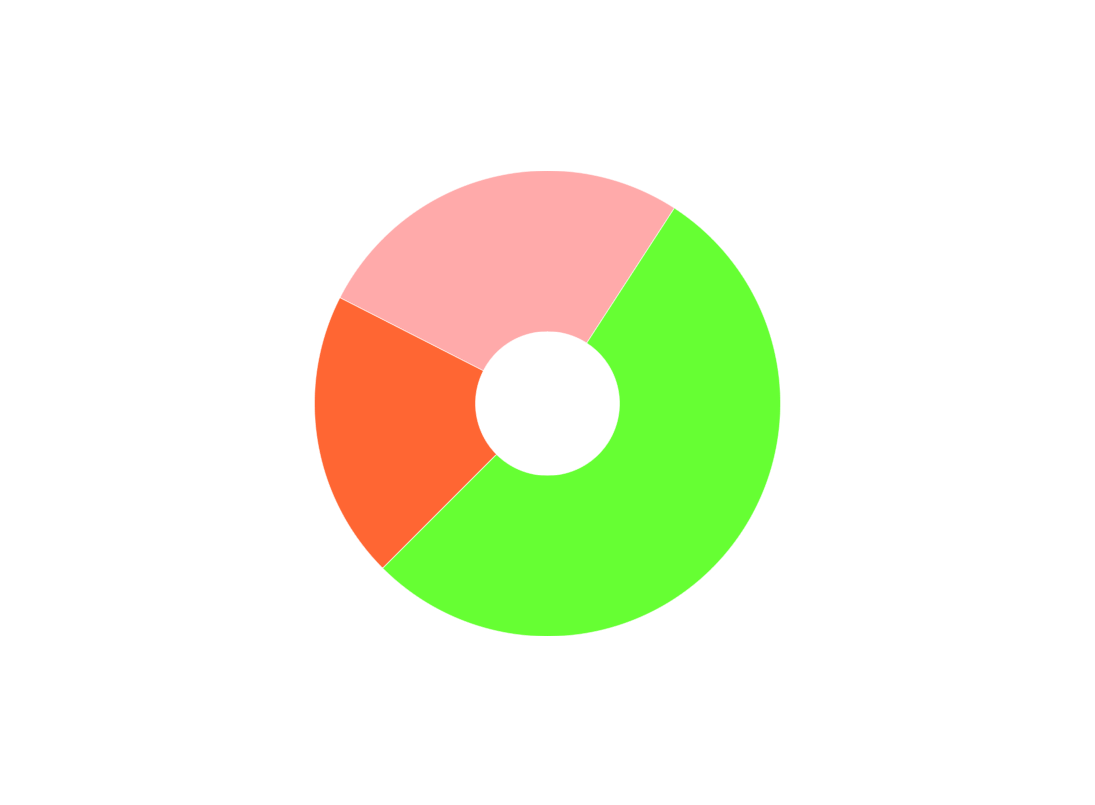
To get beautiful charts like this, we need to first create the pie graph (the circle part)
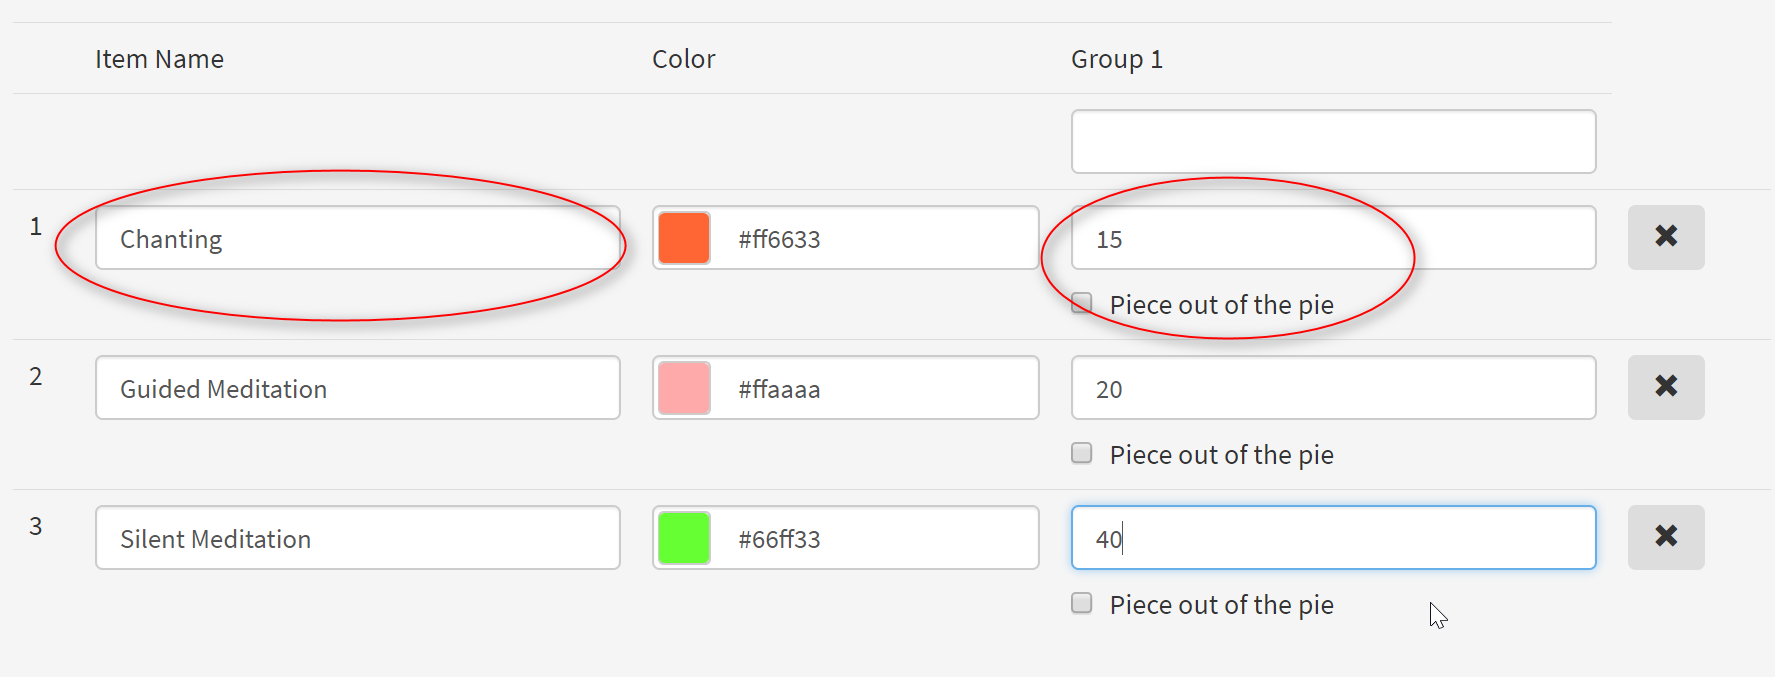
Before you begin, decide what the activites will be and how many minutes each will take. This is what we will use for our example:
| Chanting | 15 |
| Guided Meditation | 20 |
| Silent Meditation | 40 |
1. Go to https://www.onlinecharttool.com/graph
Choose Pie.

2. Then under Type select Donut. Now click the Next button at the bottom.

3. Now decide how many items you want to include. In this example, there will be three. So on the Items drop down, select 3.

4. Now enter the data. You can also choose the colors.
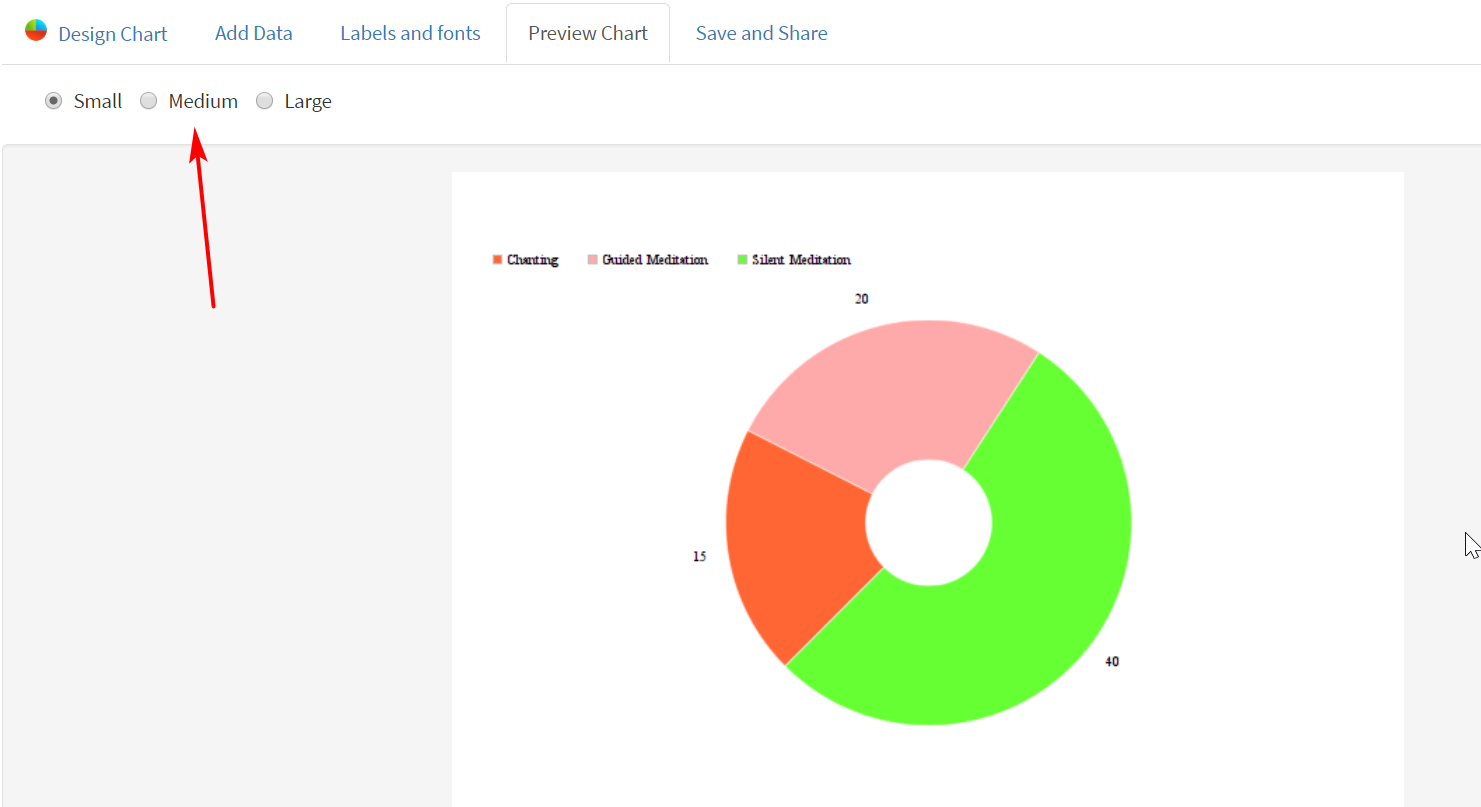
5. Select Next twice. There is no need to change fonts.
6. Now choose size. Large is best.
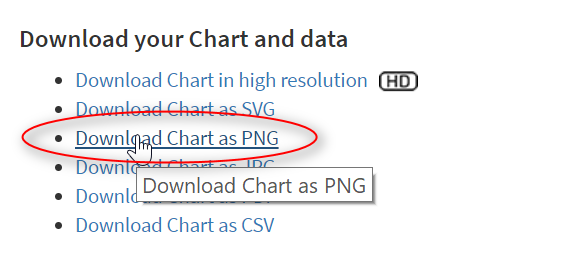
7. Now you need to save the image as a png.
8. Now you will need to take this PNG and edit it in Gimp to have nice labels. You can download this sample as a gimp file here.
Remove the text:
Add the total time in the middle:
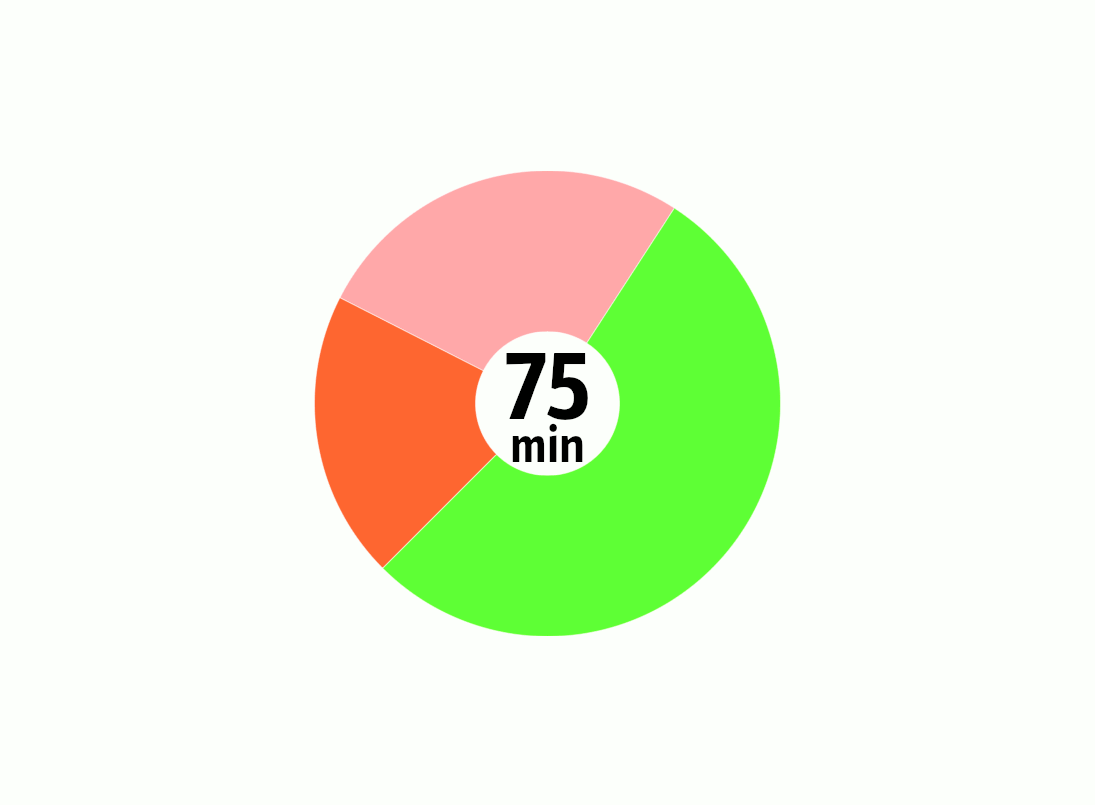
Then add the labels for each section: